### Traffic and Urban Planning
- SmartAdP: Visual Analytics of Large-scale Taxi Trajectories for Selecting Billboard Locations, Dongyu Liu, Di Weng, Yuhong Li, Jie Bao, Yu Zheng, Huamin Qu, Yingcai Wu
- SemanticTraj: A New Approach to Interacting with Massive Taxi Trajectories, Shamal AL-Dohuki, Farah Kamw, Ye Zhao, Chao Ma, Yingyu Wu, Jing Yang, Xinyue Ye, Fei Wang, Xin Li, Wei Chen
### SmartAdP
Identifying the optimal billboard locations using massive trajectory data.
#### Backgrounds
- Finding befitting areas to place billboards.
- Selecting proper locations in the specified areas.
- Evaluating a solution and convincing customers.
- Providing customers with multiple solutions.
#### Tasks and Models
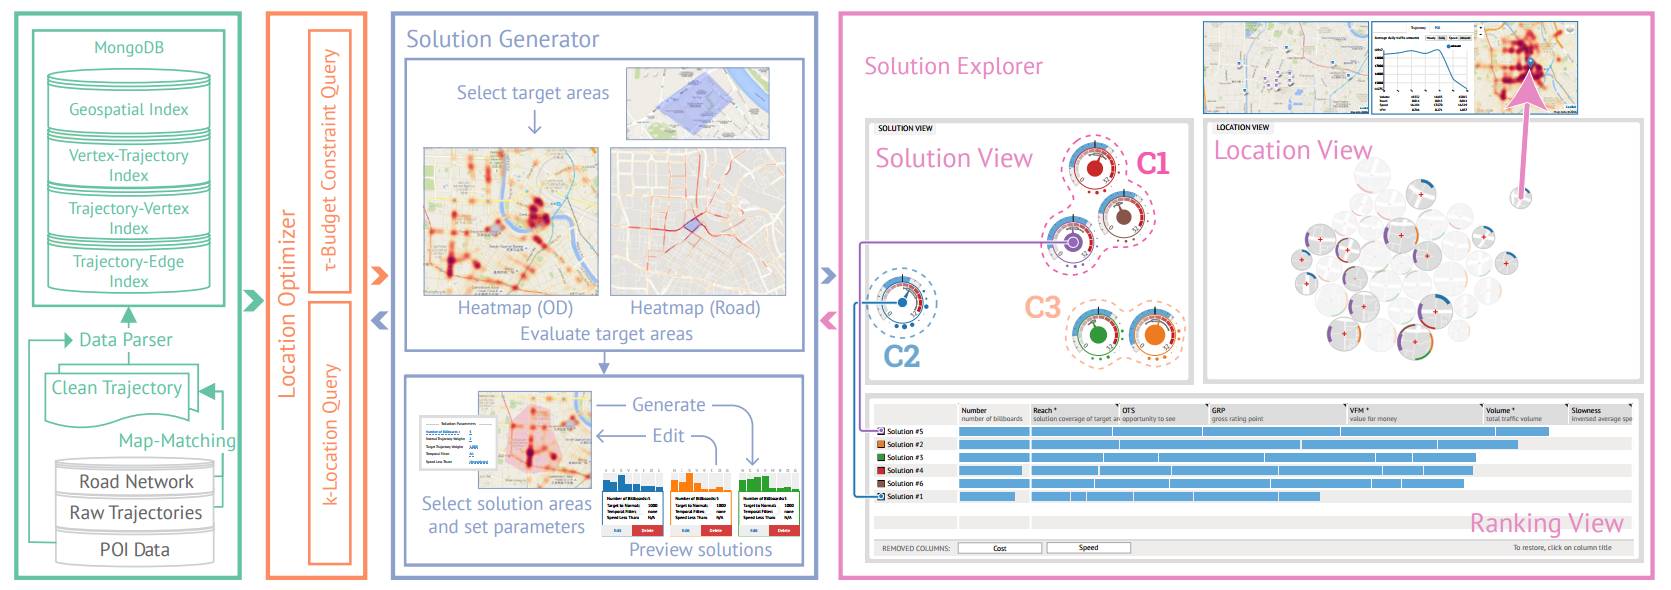
**Spatio-temporal distribution and location recommendation**: Road network data, GPS trjectory and POI data. MongoDB indexes. Two interactive queries.
#### Tasks and Visual Designs
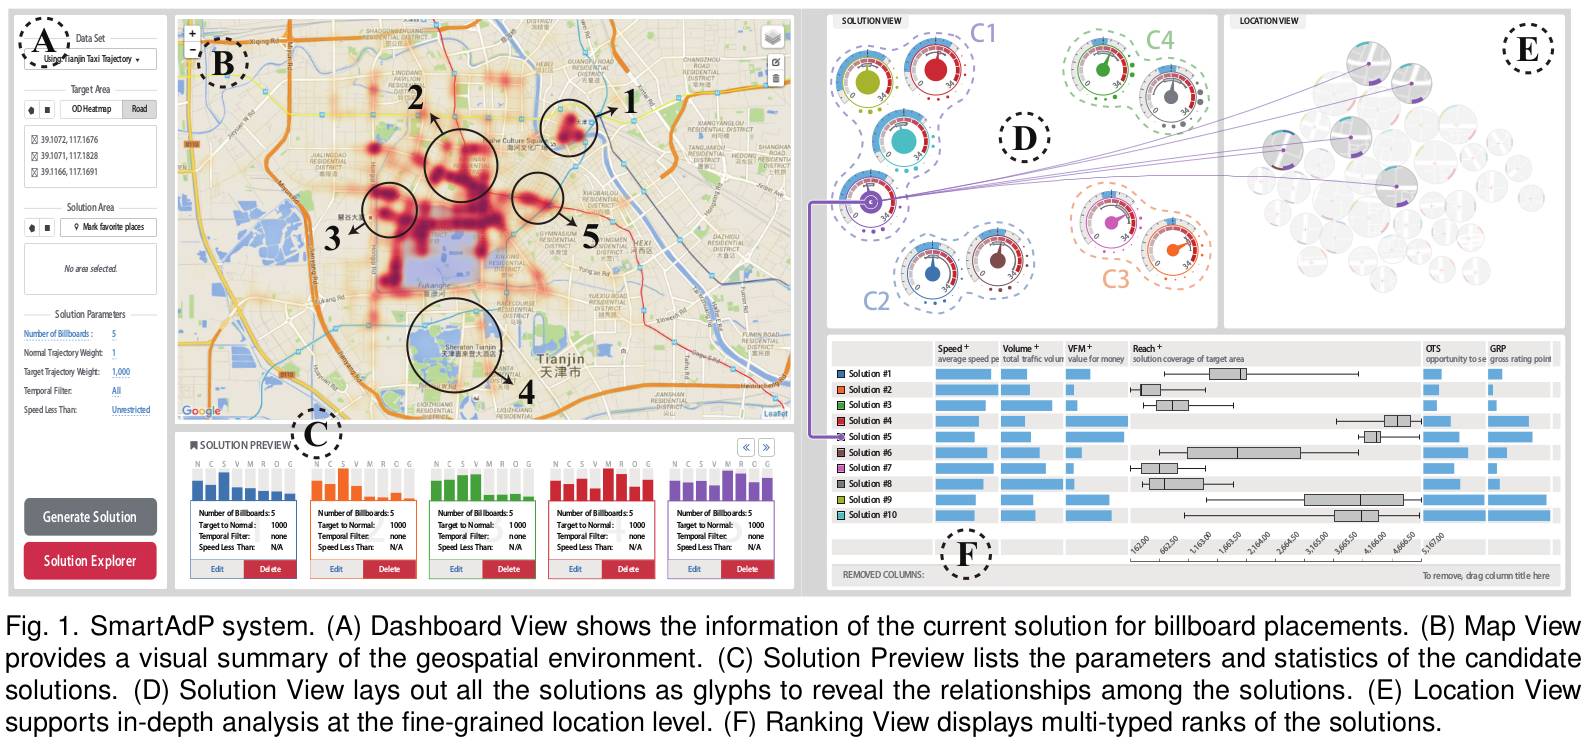
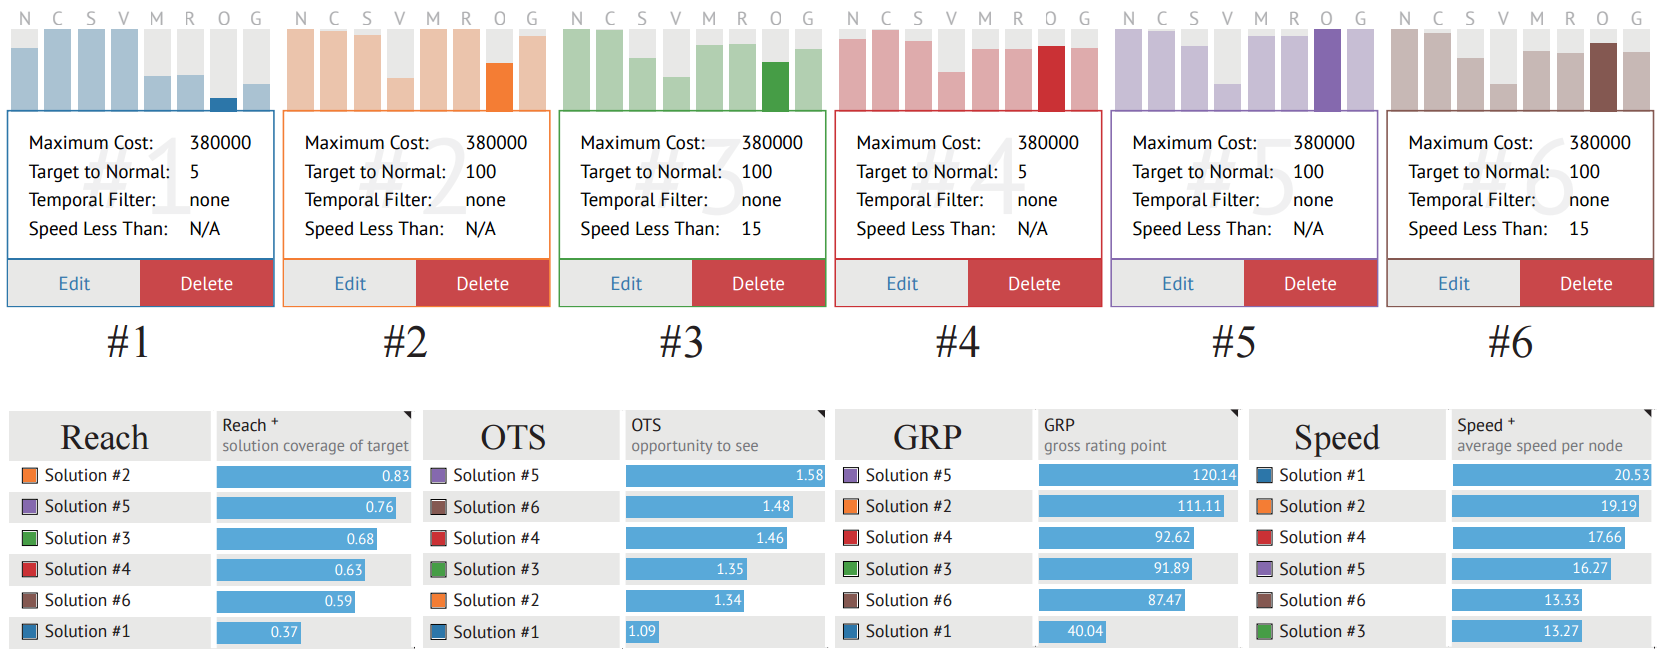
- **Results' assessment**: Locations and solutions, distributions and detailed information.
- **Solution comparison, classification and ranking**: A quick overview of the solutions can obtained by grouping solutions, ranking can help planners quickly find the desired solutions.
#### Tasks and Visual Designs
**Glyph Design**

#### Case studies
- Exploring the solution space
- Exploring the distribution of target trajectories
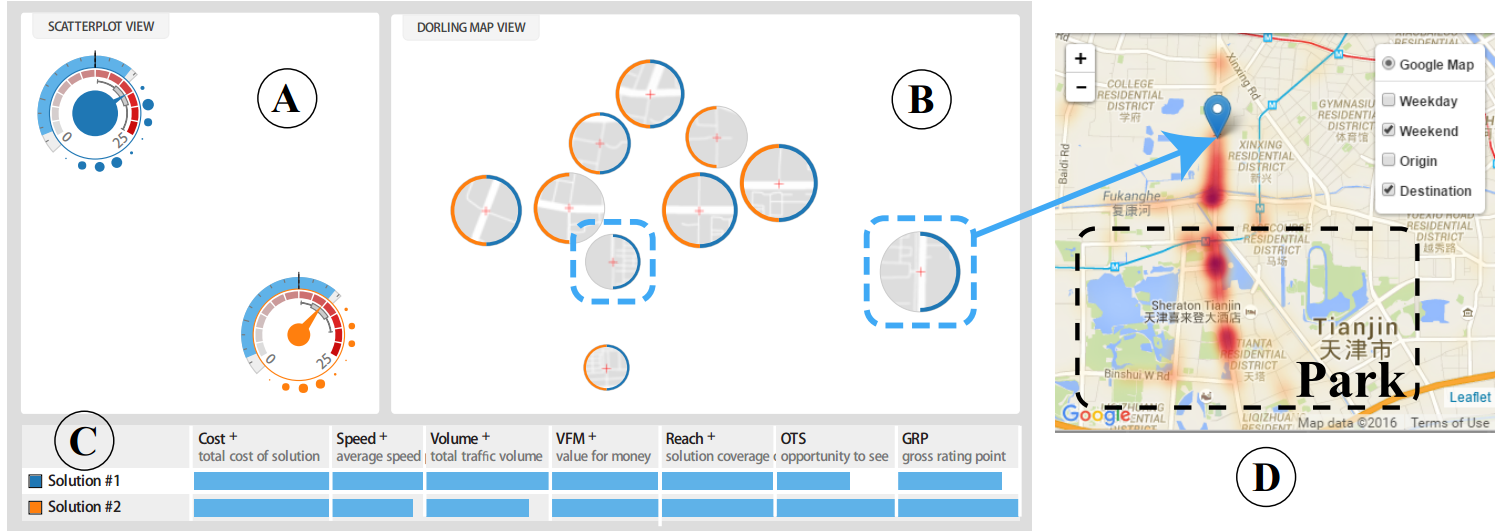
- Comparing solution areas for billboard placements
- Improving and editing solutions
- Finding the optimal solution
- Weekday and weekend
- Dispersed Strategy vs Clustered Strategy
- Domain Expert Interview
#### Case studies
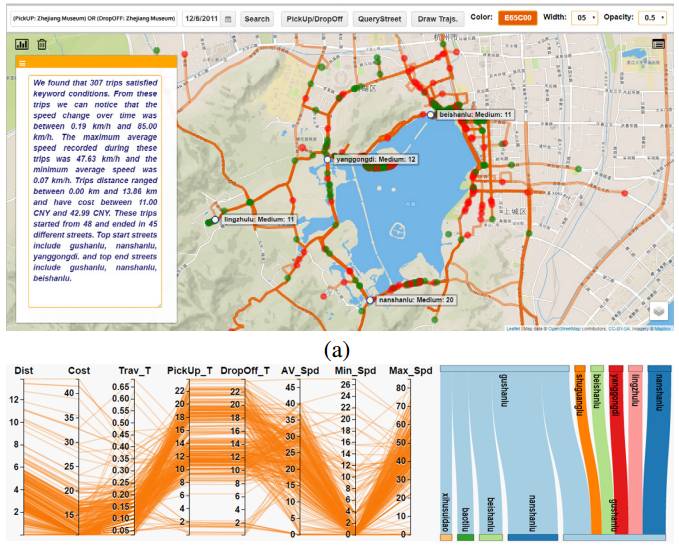
### SemanticTraj
- Typical approach to explore taxi trajectory data: Require users to select and brush geospatial region on a map: tedious and time consuming
- The method: manage visualize taxi trajectory data in an intuitive, semantic rich and efficient means.
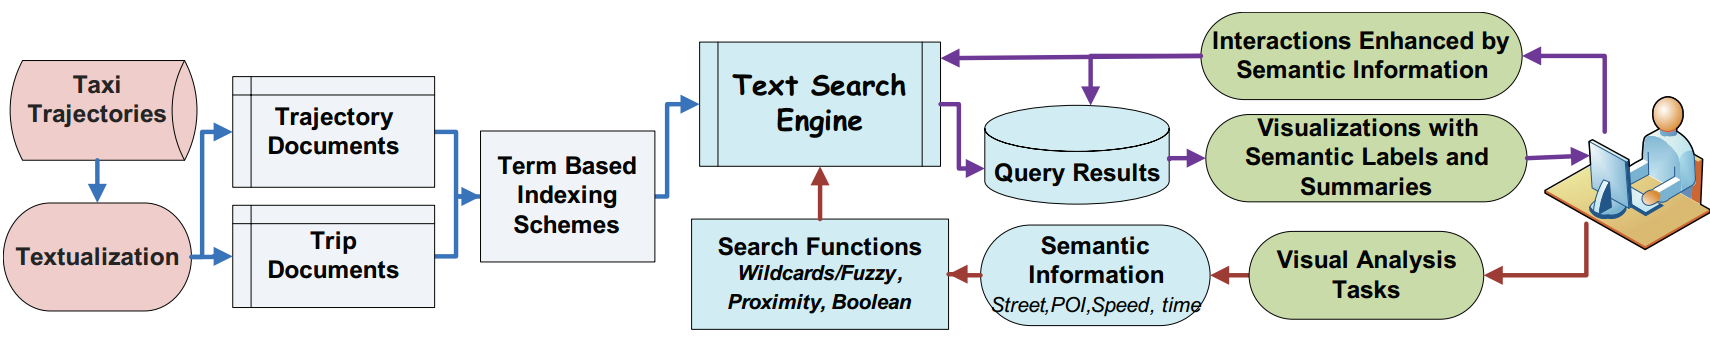
#### Components
- Textualization transformation process
- Text search engine with a corpus of taxi documents
- Semantic labels and meta-summaries of results are integrated with a set of visualizations
- Feedback from domain experts and a preliminary user study to evaluate the visual system
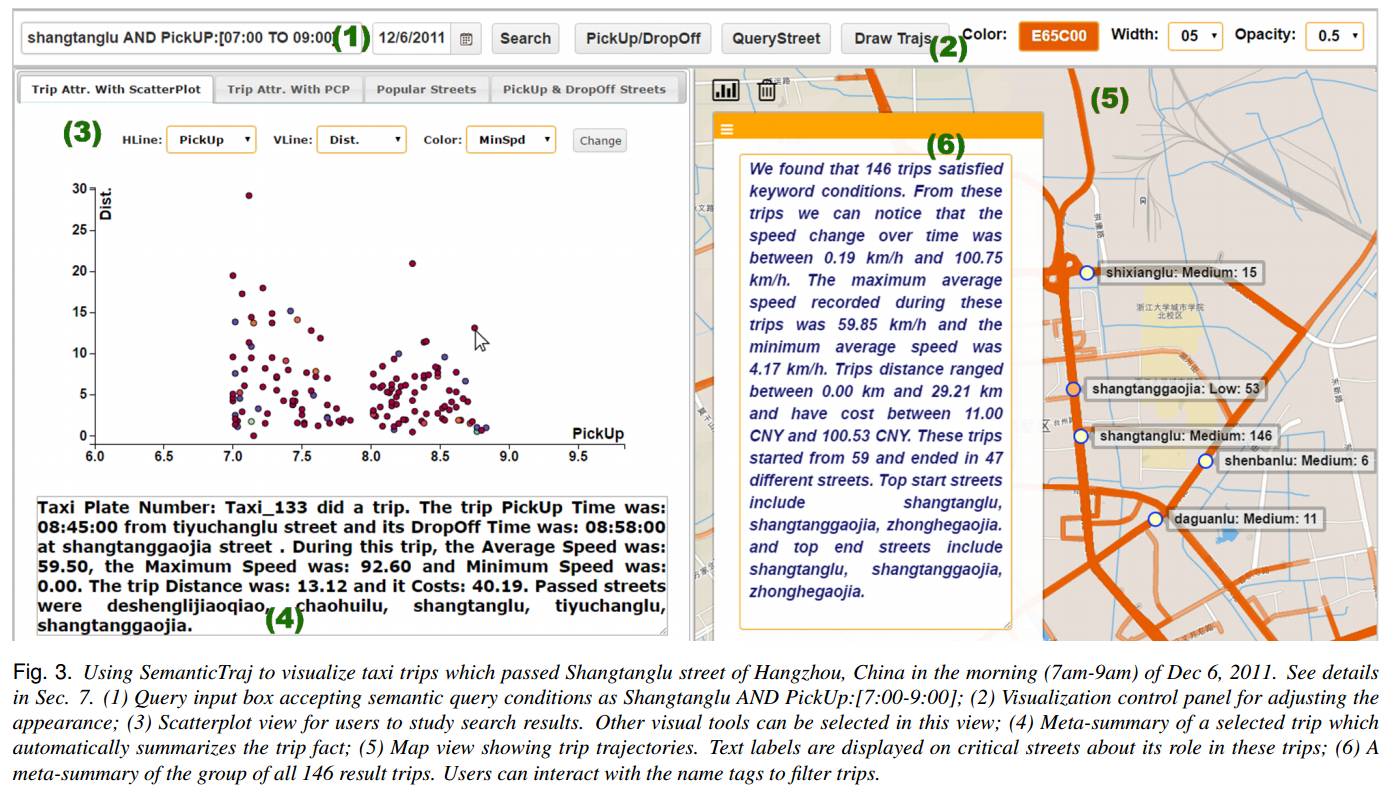
#### Visual Exploration: semantic trips search
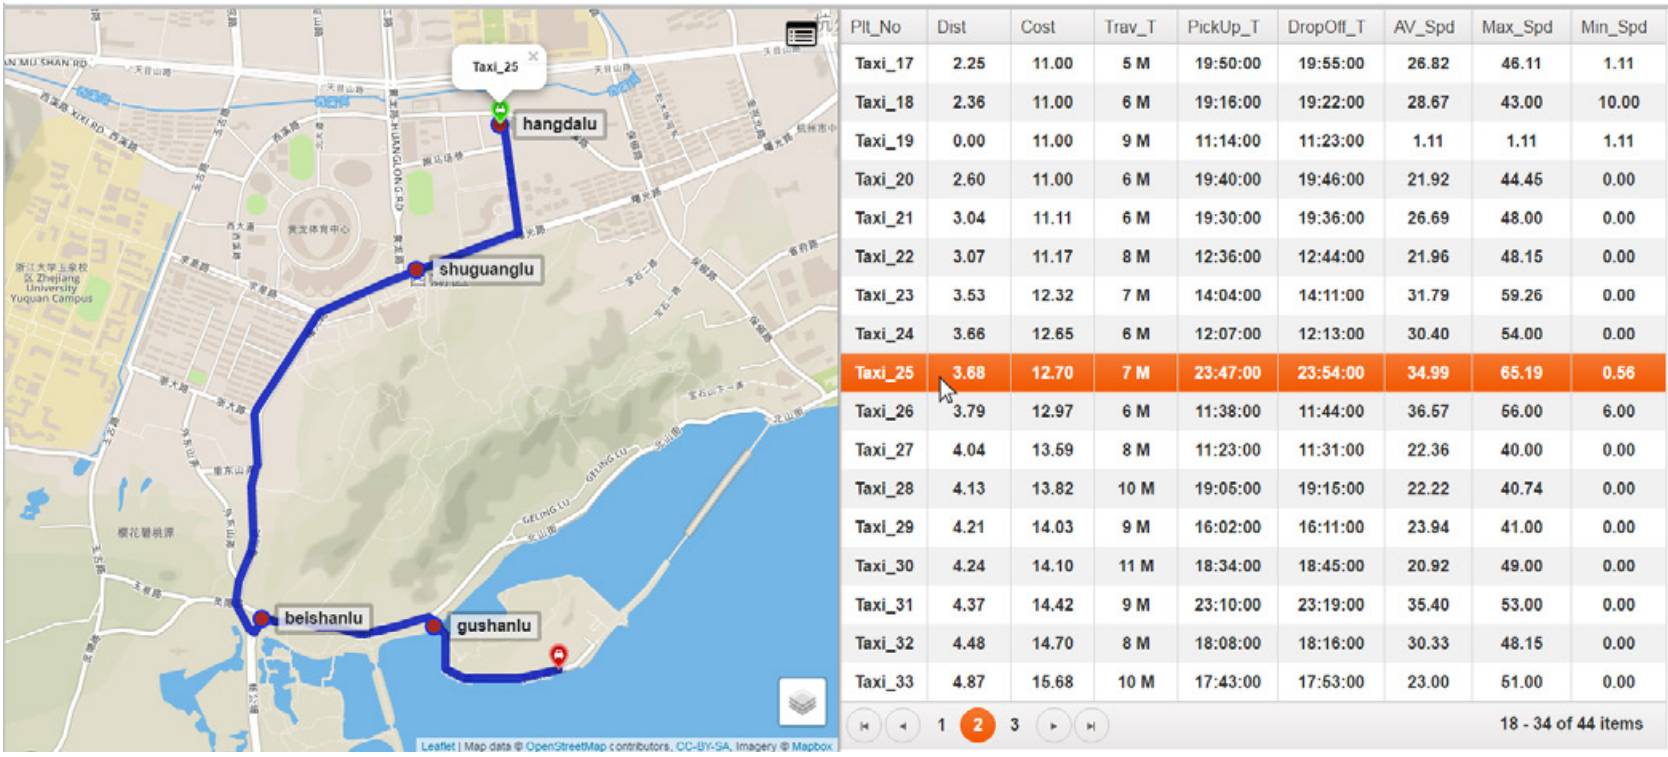
#### Visual Exploration: study individual trajectory
#### Provide shuttle buses for tourists
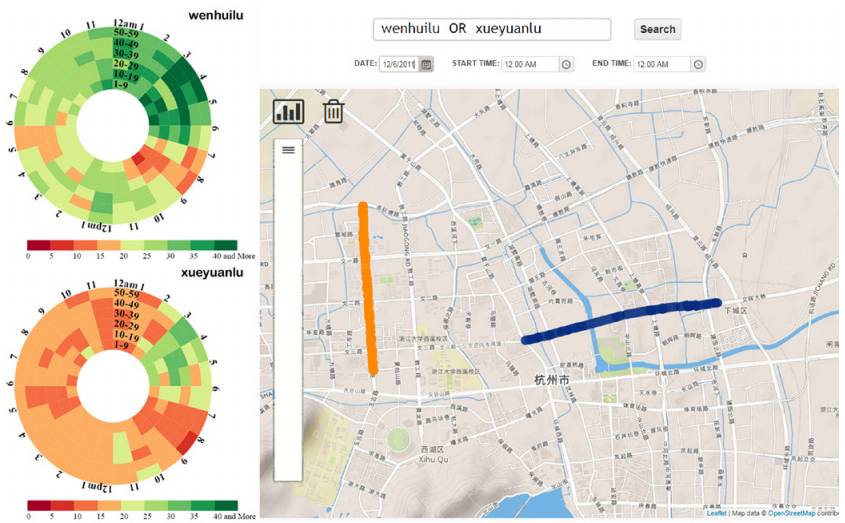
#### Study traffic information over streets
## vis.cs.kent.edu
- [NY Taxi Trip](http://vis.cs.kent.edu/NYTaxi/): Data of taxi trips. Taxi trip refers to a taxi carrying its passengers from their origin (pickup) location to destination (dropoff) location.
- [Porto Taxi Trip](http://vis.cs.kent.edu/PortoTrajectories/): Real-world mobility data of taxi trajectories. Taxi trajectory is the recording of the positions of a taxi at specific space-time domain, for a given taxi and a given time interval, it is presented as a sequence of geometric location in 2D spatial system (xi, yi, ti).
## Posters and Arts Program
### Poster: Analyzing Hillary Clinton’s Emails
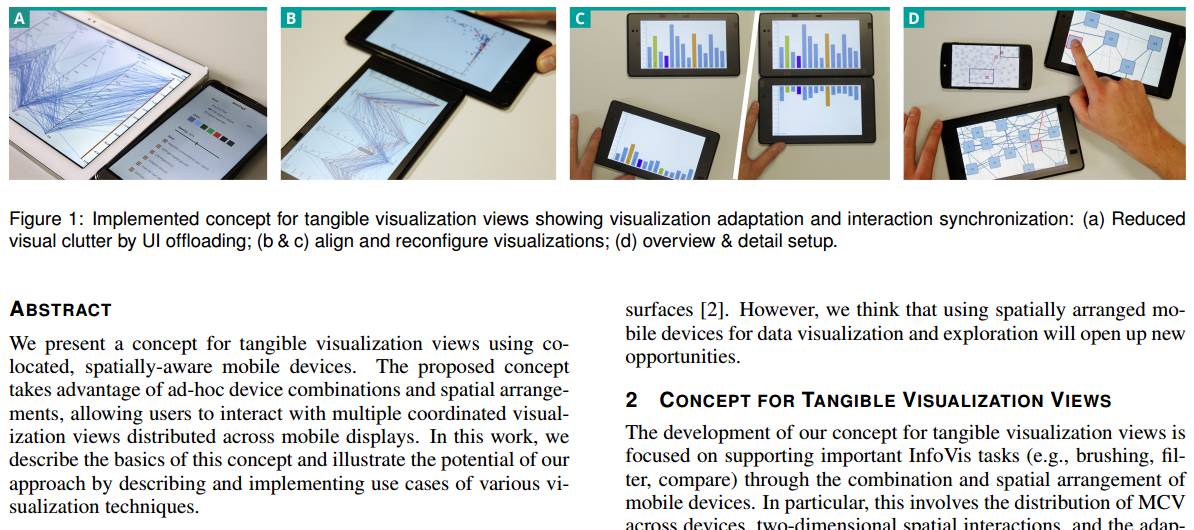
### Poster: Towards Combining Mobile Devices for Visual Data Exploration
### Workshop on Visualization in Practice
**vega**: Vega is a visualization grammar. With Vega, you can describe the visual appearance and interactive behavior of a visualization in a JSON format, and generate views using HTML5 Canvas or SVG.
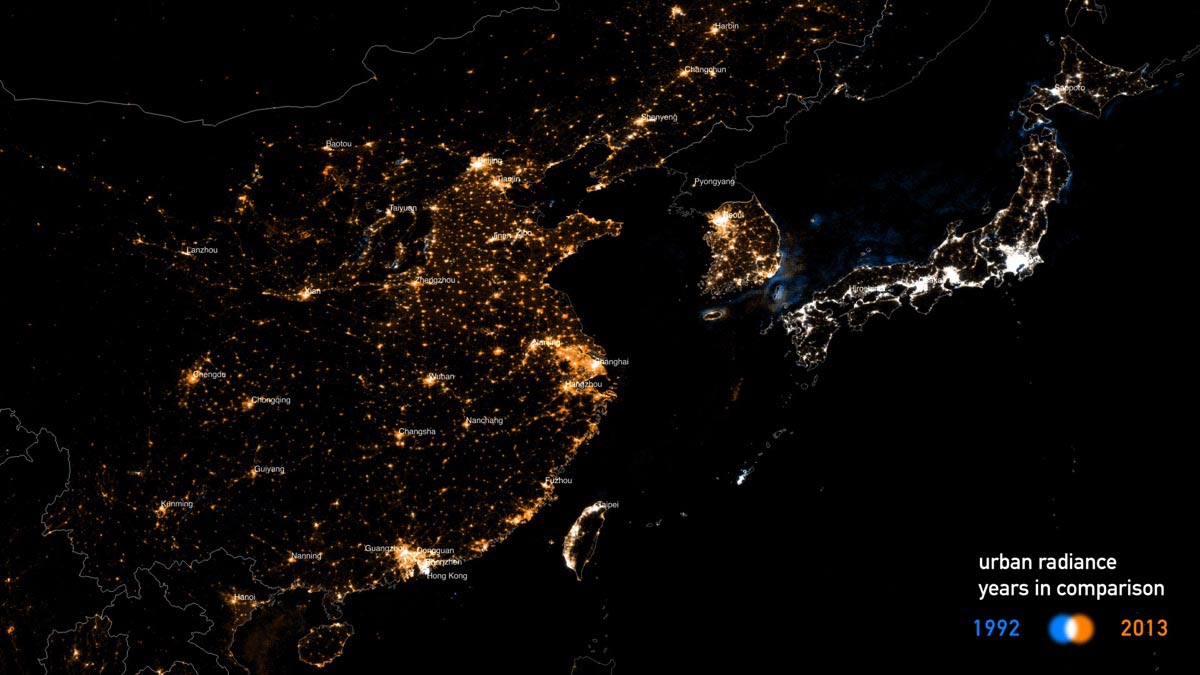
### Urban Radiance, East Asia 1992-2013